Welcome to the Artificial Intelligence Outlook for Forex trading.
VIDEO TRANSCRIPT
US Dollar Index
Okay, hello everyone, and welcome back. My name is Greg Firman, and this is the Vantage Point AI Market Outlook for the week of April the 21st, 2025.
Now, to get started this week, we’ll begin where we always do—with that very important U.S. Dollar Index. Now, looking at the dollar index, it remains bearish on the year. This previous calendar week, we can see that the volatility on the Monday bar has basically set the tone for the entire week, and the dollar did not break outside of that Monday bar range. This is something we’ve been working on in the Vantage Point Live Training Room to better identify what the actual trend is.
So, we’re basing out down here. Our neural index is rising, we have an MA diff cross to the upside, and we’re moving towards a period of known U.S. dollar strength towards the end of the month or the latter part of this coming week. Right now, it does look like the dollar has a chance to recover. Our major support low is going to be 98.880. But again, we are in a holiday-short week with Easter Monday—Happy Easter to everyone, by the way! So again, we’ll keep an eye on that low, but be very, very cautious of a bear trap below 98.880—just to be clear.
Gold
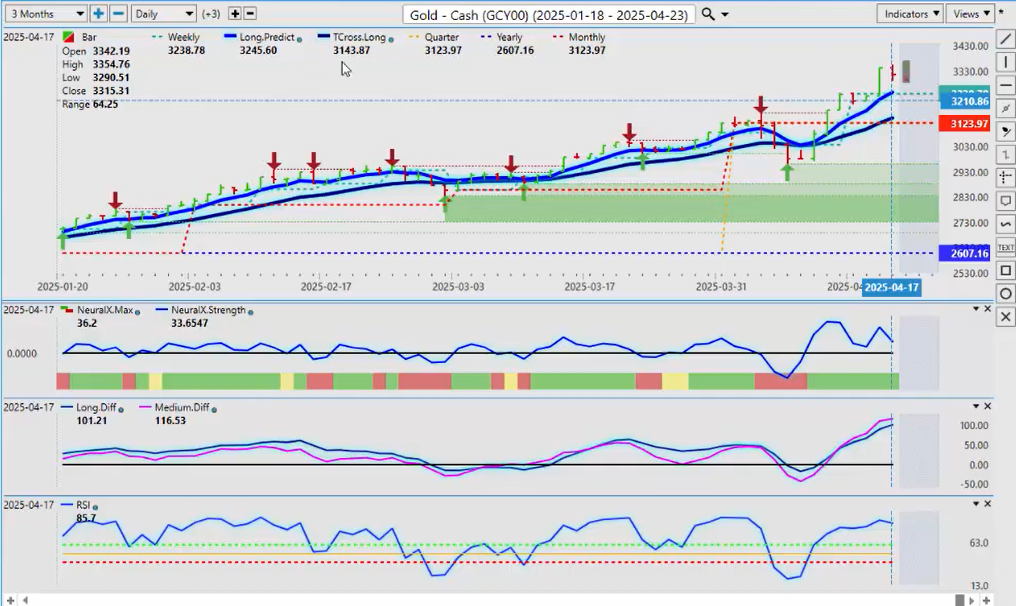
Now, when we mix things up a little bit here, we’re going to look at gold contracts. This is a full market outlook. What I’m seeing here—gold continues to extend. Our initial retracement points for the coming week are going to be 3245 and 3143. If we come into a period of dollar strength, it’s entirely possible that gold could get down to 3143, but likely the buying opportunity would come between these two custom predicted moving averages based on the correlation to 31 other markets. So keep an eye on that area.
Right now, gold is looking a little bit toppy here for sure. But again, we don’t want to be trading overbought and oversold signals—we want to be trading momentum. In my respectful opinion only, we let it retrace down into these levels and then continue to stay with the primary trend, which is clearly up on gold, but just try and get a better entry point.
S&P 500 Index
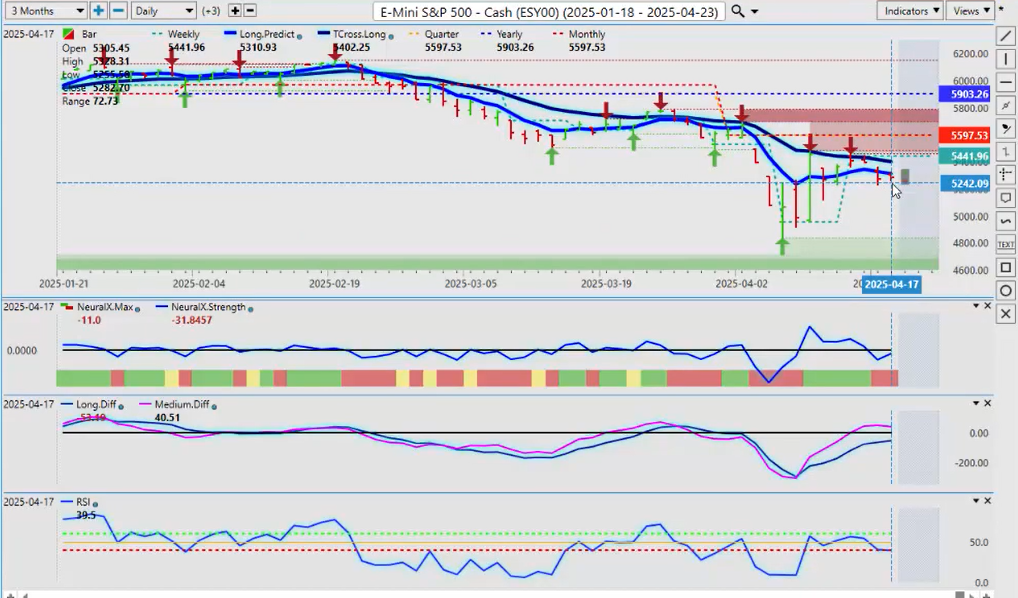
Now, the S&P 500, again, pretty resilient, but it remains negative on the year. We’ve had a retracement this past week—another great example of using the T Cross Long as a pivot level. We’ve come back up, hit into the 54 area here. You can see up at this area, about 5439 approximately, where the T Cross Long resides, and then we had a pretty strong failure.
We’re in a holiday-short week—last week and this coming week. We do have a medium-term crossover—that’s the pink line crossing the zero line. We have very little downward momentum. Using a custom predicted RSI, using a 60/40 split and speeding it up—changing it from a 14-period to a 9-period—helps get the lag out of it. But more importantly, we want to see if we’ve got downward momentum, and currently, this is saying no.
If we get another big sell-off tomorrow on Monday, then that is likely a buying opportunity at the end of the day or into Tuesday. That’s the cycle I’ve seen: a lot of crazy volatility on Monday, some very unusual media announcements that continue to come out every single Monday—only to be forgotten or corrected on Tuesday. Keep an eye on that.
Be very, very cautious of a bear trap on equities, but I will concede—we’ve got to get above this T Cross Long at 5402 and stay above it in order for that trend to theoretically reverse.
Crude Oil
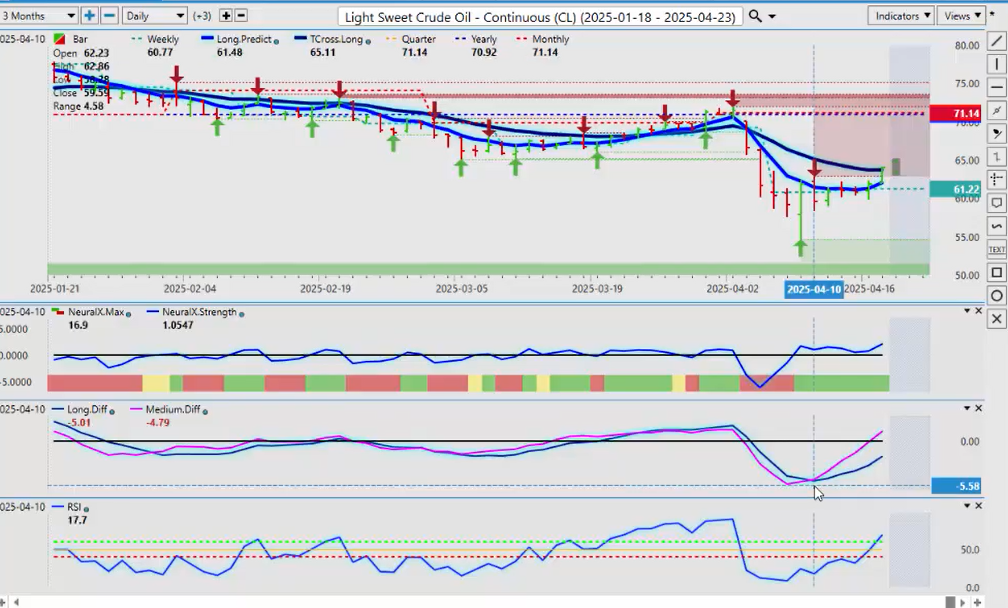
Now, oil contracts were recovering last week—they are looking good. A very pronounced MA diff cross—the pink line over the blue line—means that the medium-term strength to the downside is weakening against that long-term strength. When the pink line crosses over the blue line, that’s a custom signal only visible in the Vantage Point software, and in my respectful opinion, it’s one of the most powerful trend-based indicators. It’s contrarian too—meaning the market is moving lower, and the MA diff is showing something very different, just like the neural index strength.
A good point here—the neural index is red, but the neural index strength is moving higher as the market is moving lower. Eventually, it turns around and retraces back to the upside, taking out all the shorts.
For this coming week, that T Cross Long—6373—we have to break above that level, or the primary trend to the downside remains in place. If you’re using that T Cross Long, we can straddle this area. Those who believe in the primary trend can sell into 6373. If you believe oil is going higher, place buy limit orders just above 64. If it breaks above the T Cross Long, you immediately pick up that long trade because you know your levels.
This is an outlook, not a recap—we want to be prepared going into next week’s trading. The indicators from VP are suggesting we break above that T Cross Long, and setting buy stops above 64 is a reasonable play.
Bitcoin

Now, Bitcoin going into next week is starting to form a buy signal. What we want to keep an eye on: each day last week, we were bouncing off either the Long Predicted or the T Cross Long. Key levels are 84,573 and 83,378. If we can hold this, we should move higher. My only concern is the MA diff cross—some of you have affectionately called it the “death cross.” I love that, because it can be exactly that for a long trade.
As long as that pink line stays above the zero line, I think we’re okay. Ultimately, this year, Bitcoin still looks higher. We’re in the third year of a three-year rally before a major corrective move likely next year—that would be yet another buying opportunity.
We’re holding above our quarterly opening right now—82,454 is the key level you want to watch.
Volatility Index ($VIX)
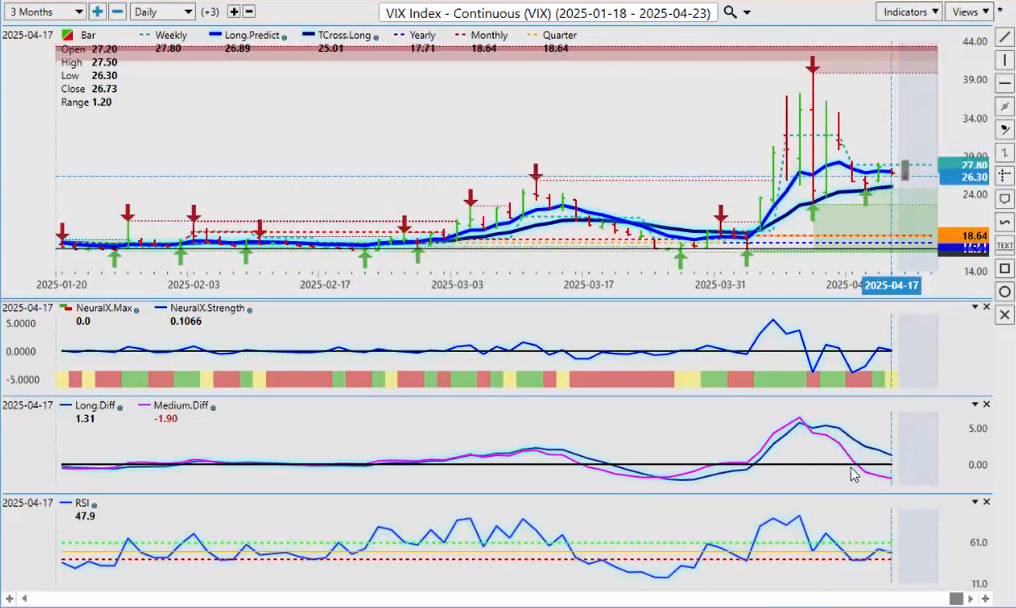
Now, let’s look at the European markets and the VIX. Starting with the VIX—it’s struggling. We’ve had a medium-term crossover, the pink line crossed the zero line, and the predicted RSI, neural index, and neural index strength are pointing positive. We’re still above the T Cross Long, but that level may give way soon if tariffs back off
DAX
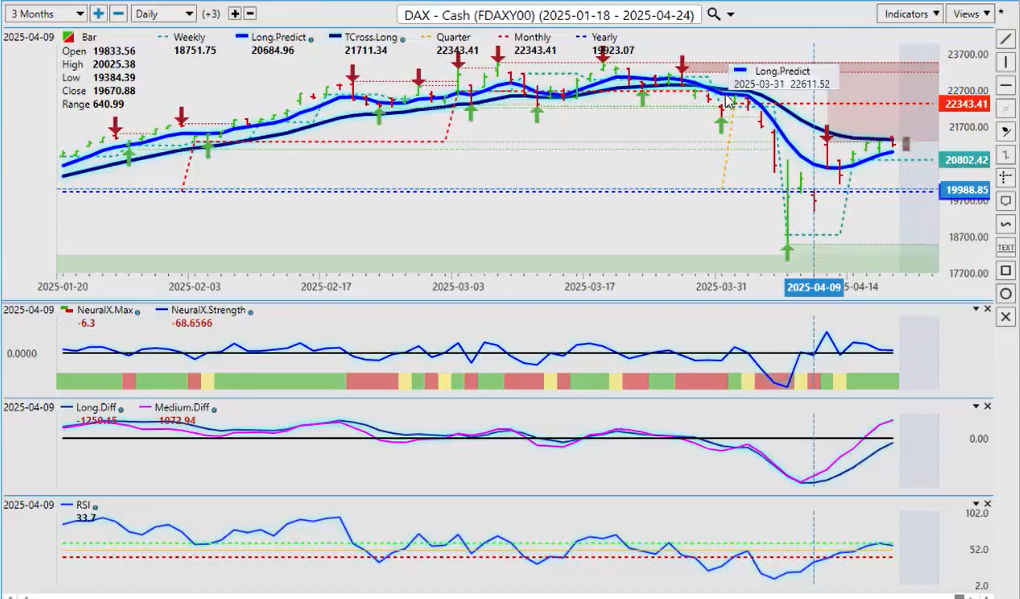
But we also want to make sure that we’re looking at, uh, our friends over in Germany and Europe, and what’s happening there. As I was talking last week, the yearly opening price really is a defining point here—between bullish and bearish, or is the trend up or down?
So, the DAX has done a heck of a job fighting the selloff we’ve seen in the U.S. and the U.S. markets. But right now, the DAX is at a pivotal area. We’re at our T Cross Long—we’ve got to get above 21,352—but we’re also holding above that critical yearly opening price.
So again, uh, I believe longs are still reasonable here with the ECB cutting again. That should boost the DAX. Uh, but again, when we look at that MA diff cross, you can see that same death cross here to the upside.
So again, as long as we know where our key resistance is and our support, what we could see here next week is this particular index trade between the T Cross Long and the yearly opening price. But we’re looking for a break on either side of those two levels, and then ride that wave, guys—that’s the key thing.
So, that is my, uh, my advice on the DAX, for my good friends in Germany.
Euro versus U.S. Dollar
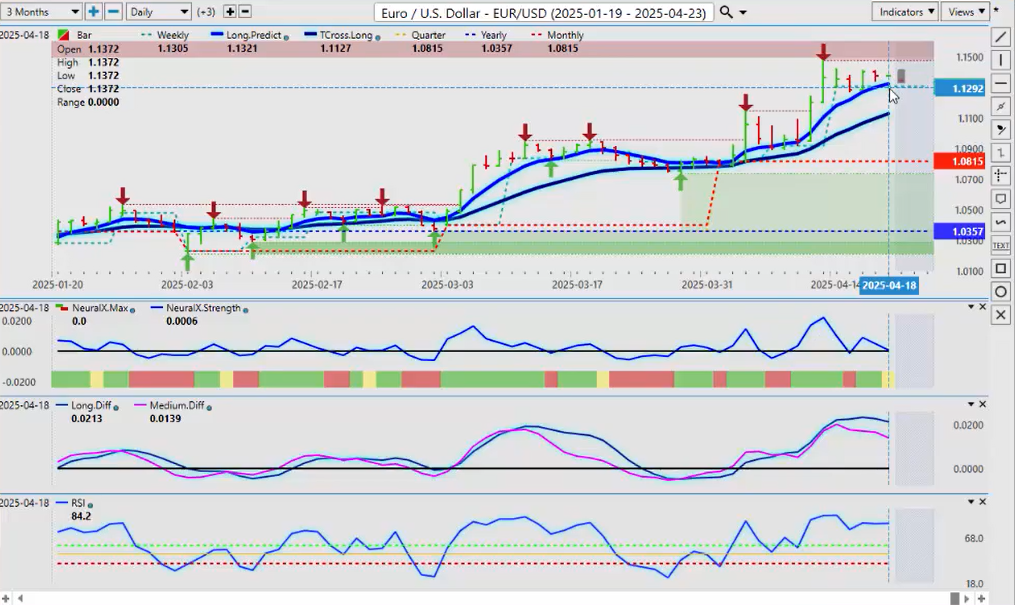
Now let’s look at some of our main forex pairs, starting with, of course, Euro/U.S. Dollar. Now, the ECB cutting last week—you can see that the euro had a big push up to the high of 1.1474 and then has completely stalled out here.
I believe we can retrace lower back to our T Cross Long and our Long Predicted. Those areas are 1.1321 and 1.1127. I believe the euro moves lower either way—tariffs or no tariffs—by the latter part of next week. Once we get past the holiday Monday, then Tuesday through Friday, I believe we’ll see the real price in the euro, and that’s likely to be to the downside. That would be corrective in nature, and those are the key levels from which we would look to buy.
Still, I believe we have a decent sell right out of the gate. The euro aggressively moves higher on Monday, only to flip and turn down on Tuesday. Be very mindful of Monday and Tuesday, because technically Monday is a government and bank holiday—we may not see the real price until Tuesday or Wednesday.
U.S. Dollar versus Swiss Franc

If we do see dollar strength, then the U.S. Dollar/Swiss Franc pair becomes interesting. Looking at the chart, we traded the entire week within the high and low of the Monday bar. I’ll go over this more in the seminar in Tampa this coming week, but just as a teaser—you can see we didn’t break out all week. That’s usually a warning sign, especially after a big move down, that we’re getting ready to break higher.
Watch the low support level around 0.81. For now, the MA diff cross is suggesting more dollar strength.
British Pound versus U.S. Dollar
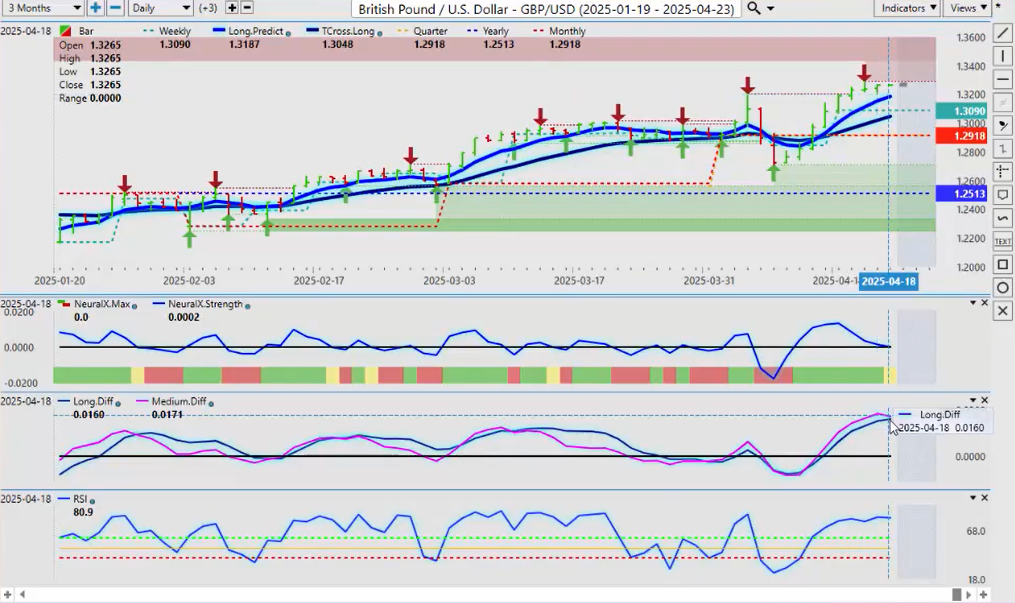
The British Pound/U.S. Dollar pair looks similar. A death cross seems to be forming with that pink line turning down. Neural index and neural index strength are showing divergence—one green, one weakening. If the pink line crosses below the blue line, that’s a strong short setup. Your target levels would be the T Cross Long at 1.3480, with the first support at 1.3187.
Because again, this is an outlook, not a recap of something that’s already taking place. We’re talking about what’s going to happen, not what’s already taken place—very, very different. You’ll notice a lot of conventional indicators—they show you things after they’ve happened. We’re talking about it before it’s even taken place, right?
So, with conditions that need to occur, that Dollar Index needs to move higher. And if it does, then it’s going to pull a lot of the other currencies down, right? So that would be our initial targets.
But I will certainly concede, the British pound is positive on the year, it’s positive on the month and the quarter. So these would be retracement areas—not necessarily a new downtrend.
U.S. Dollar versus Japanese Yen

Now, when we look at the Dollar/Yen, once again, the Dollar/Yen is putting up a fight. You can see we’re stalling out down here—that low in that lower 142 area. But if we see some dollar strength mid- to late-week, then the Dollar/Yen could recover—but that would be a selling opportunity. I truly believe the carry trade is going to come unwound, and it would favor the yen versus the dollar.
So for now, again, we’re basically neutral on this. But selling towards the T Cross Long at 145.56—I believe that to be more reasonable. I think the 143.19 area will break midweek, but the T Cross Long will be our backup, and that’s the area we would target for shorts. I believe the indicators in VP will validate that later in the week.
But getting in front of these things—the initial move is likely to the upside, and we would be looking for a short opportunity.
U.S. Dollar versus Canadian Dollar
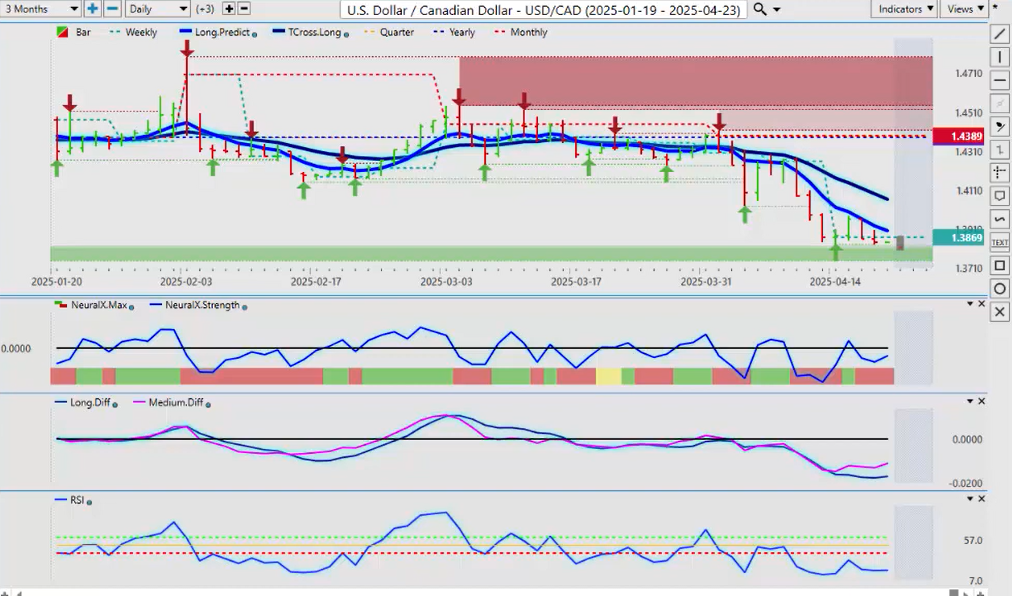
Now, with the U.S. Dollar/Canadian Dollar pair—again, we’re going into a Canadian election here at the end of the month. So you’re going to see some volatility around the Canadian dollar. In most cases, the Canadian dollar is stronger in May, June, and July because of rising oil prices. The intermarket correlation, of course, is that rise in oil and equities helps the Canadian, the Aussie, and the Kiwi—very similar trade, if not the same, between those three forex pairs.
So right now, we’re holding down here. We do have a low point coming in at 1.3829. Be very, very cautious of a bear trap here, guys, because aside from oil, there is very little reason to be buying the Canadian dollar at this time—with the political uncertainty, rising unemployment, and falling GDP.
But again, we’ll monitor it. We’ll see what the outcome of the Canadian election is, and maybe we’ve got a new path for the Canadian dollar. But my optimism on that, at this time, remains heavily guarded.
Right now, we do have an MA diff cross that’s warning us we could be turning higher, and our retracement points would be back to our T Cross Long—between 1.3900 and 1.4061. If I am going to sell the U.S. Dollar/Canadian Dollar pair, that’s where I would prefer to do it—not down here, guys. I believe a bear trap is forming.
Australian Dollar versus U.S. Dollar
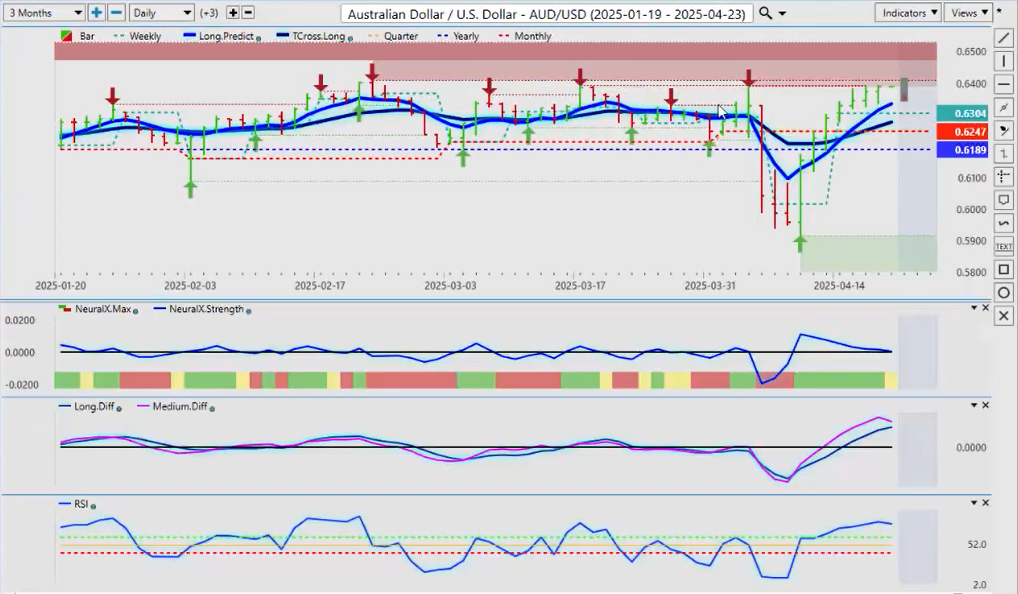
Now, with the Aussie and the Kiwi, again, the Aussie struggled a little bit this past week. But I believe it can recover—we just need the equity markets moving higher. Sorry—excuse me—it didn’t struggle this week; it just stalled at our verified resistance high, 0.6388. So that’s where the problem area is going to be.
I believe the Aussie still goes higher this year. We’re above our yearly opening price and our quarterly opening price. But our retracement point is back down here at 0.6247. I would much rather pick it up near the T Cross Long—0.6276. That’s a solid area for buying, guys.
Or again, I will give something to the bulls here too—it’s an aggressive one: you can buy the breakout of 0.6388. But be careful of a bull trap—only for the reason that, in most cases, the U.S. dollar is strong at the end of the month. So after we get past that, I believe we’ll still have that long on the Aussie and the Kiwi.
New Zealand Dollar versus U.S. Dollar
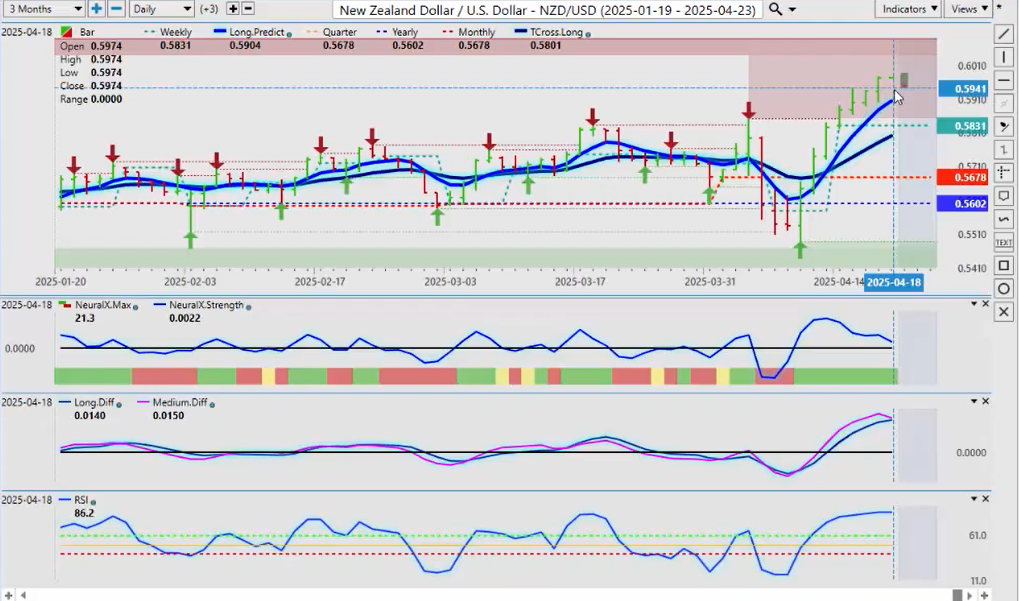
Again, when we look at the Kiwi, it’s the same trade—virtually identical—but the Kiwi is further overextended than the Aussie. So again, I think the Kiwi has a greater area to fall.
So, a way for the Forex people watching this video to understand Aussie/New Zealand—it’s composed of Aussie/U.S. and New Zealand/U.S.. I believe that should the Kiwi—the New Zealand/U.S. Dollar—fall, then there would be a potentially very good buying opportunity this coming week on Aussie/New Zealand.
We have a low of 1.0695, and I believe that to be solid support. If we have a breakdown below that on Monday, chances are Tuesday will confirm that it’s actually a bear trap down here. So keep an eye on that.
But if the New Zealand/U.S. Dollar starts moving lower and Aussie/U.S. turns higher, then that’s going to benefit this particular pair. But be very cautious, as we have a holiday on Monday.
So with that said, this is the Vantage Point AI Market Outlook for the week of April the 21st, 2025.

www.vantagepointsoftware.com (Article Sourced Website)
#Vantagepoint #Market #Outlook #April