HMM4 Indicator Documentation
Introduction
The HMM4 indicator is a powerful technical analysis tool that uses a 4-Gaussian Hidden Markov Model (HMM) to identify market regimes and predict potential market direction. This indicator applies advanced statistical methods to price data, allowing traders to recognize bull and bear market conditions with greater accuracy.
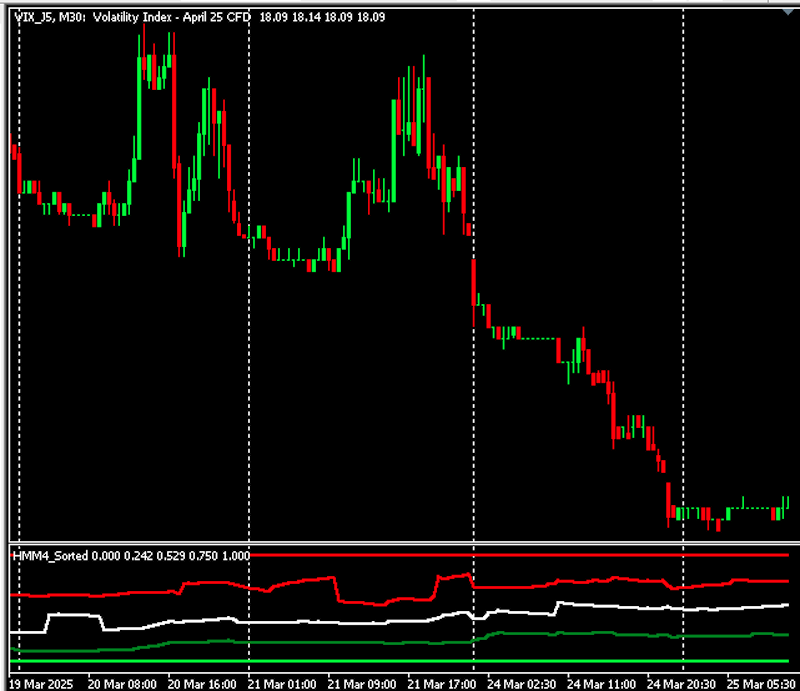
The indicator displays a stacked line chart in a separate window, representing the mixture weights of four different Gaussian components. These weights provide valuable insights into the current market state and can be used to make informed trading decisions.
Free Research Article here:
https://www.researchgate.net/publication/369246349_A_Gaussian_Mixture_Model_for_the_VIX
Theoretical Background
Hidden Markov Models and Gaussian Mixtures
A Hidden Markov Model (HMM) is a statistical model where the system being modeled is assumed to be a Markov process with unobservable (hidden) states. In financial markets, these hidden states can represent different market regimes such as bull markets, bear markets, and transitional phases.
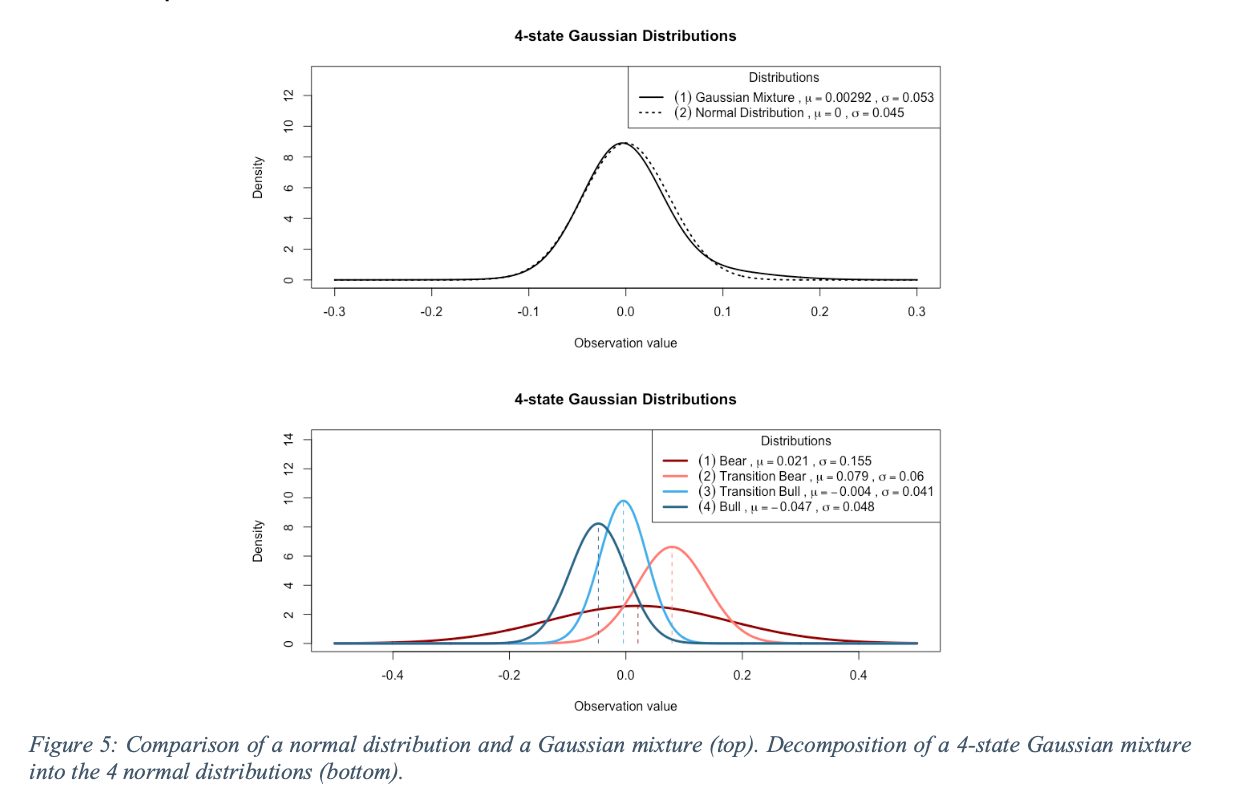
The HMM4 indicator uses a continuous HMM with a Gaussian mixture model. This approach models the price data as a mixture of four Gaussian (normal) distributions, each representing a different market state. The key advantage of this approach is that it can model non-normal distributions that are commonly observed in financial time series.

Market Regimes and Weight Interpretation
The four Gaussian components in the model can be interpreted as different market regimes:
- Bear State – Associated with increasing volatility and often negative price movement
- Transition Bear – Transitional phase moving toward bearish conditions
- Transition Bull – Transitional phase moving toward bullish conditions
- Bull State – Associated with decreasing volatility and often positive price movement
The weights of these components represent the probability of the market being in each state. These weights always sum to 1 (or 100%), making them easy to interpret as percentages.
Bull/Bear Market Identification
A key insight for trading is that the cumulative weight of the first two components (weight1+weight2) can be used to identify bull and bear markets:
- When weight1+weight2 > 50%, this indicates a bull market
- When weight1+weight2 < 50%, this indicates a bear market
This simple rule provides a clear signal for potential market direction and can be used as part of a trading strategy.
Indicator Features
Visual Representation
The HMM4 indicator displays a stacked line chart in a separate window with five plots:
- Weight Zero (bottom layer, lime color) – Always 0, serves as the baseline
- Weight 1 (green color) – First component weight
- Weight 1+2 (dark green color) – Cumulative sum of first and second component weights
- Weight 1+2+3 (dark red color) – Cumulative sum of first, second, and third component weights
- Weight 1+2+3+4 (red color) – Always 1.0, as all weights sum to 1
Sorting Mechanism
The indicator sorts the Gaussian components based on the product of their means and variances (μ·σ²). This sorting ensures consistent identification of the states across different time periods, with the most positive means with the biggest standard deviations ranked first (most bearish) and the most negative means ranked last (most bullish).
Input Parameters
The HMM4 indicator has the following input parameters:
- TrainingBars (default: 100) – Number of bars to use for training the model. If fewer bars are available, the indicator will use all available data.
- EMIterations (default: 10) – Number of iterations for the Expectation-Maximization algorithm. Higher values may provide more accurate results but take longer to calculate.
- StartBarsAgo (default: 1000) – Number of bars ago to start the calculation. This determines the initial historical data used.
- UseFixedStartPoint (default: false) – When true, the indicator uses a fixed start point for training data. When false, it uses a sliding window approach.
- LineWidth (default: 1) – Width of the lines in the subplot. Adjust this value (1-5 recommended) to change the thickness of the displayed lines.
Trading Applications
Market Regime Identification
The primary use of the HMM4 indicator is to identify the current market regime. By observing the stacked weights, traders can determine whether the market is in a bullish or bearish state.
Trading Signals
The indicator can be used to generate trading signals based on the cumulative weights:
- Bull Market Signal – When the cumulative weight of the first two components (Weight 1+2) exceeds 50%, this suggests a bullish market environment. Traders might consider long positions or holding existing long positions.
- Bear Market Signal – When the cumulative weight of the first two components falls below 50%, this suggests a bearish market environment. Traders might consider short positions or reducing exposure to the market.
Integration with Other Indicators
For best results, the HMM4 indicator should be used in conjunction with other technical indicators and price action analysis. It works well as a confirmation tool for trend-following strategies and can help identify potential market turning points.
Technical Implementation
EM Algorithm
The indicator uses the Expectation-Maximization (EM) algorithm, specifically a simplified Baum-Welch style algorithm, to train the Hidden Markov Model. This iterative algorithm finds the maximum likelihood estimates of the model parameters.
Retraining Process
The indicator retrains on each new bar by accumulating data. This adaptive approach allows the model to evolve as market conditions change, providing up-to-date insights into the current market regime.
Global Published Values for EA Access
The indicator provides global published values with the HMM4_ prefix that can be accessed by Expert Advisors (EAs). These values represent the most recent calculated weights and are updated on each new bar:
- HMM4_Weight1 – First component weight
- HMM4_Weight2 – Second component weight
- HMM4_Weight3 – Third component weight
- HMM4_Weight4 – Fourth component weight
- HMM4_CumWeight1 – Cumulative weight 1 (same as Weight1)
- HMM4_CumWeight2 – Cumulative weight 1+2
- HMM4_CumWeight3 – Cumulative weight 1+2+3
EAs can access these values directly when the indicator is included in the EA’s chart. This allows for easy implementation of automated trading strategies based on the HMM4 indicator’s market regime identification. For example, an EA could implement a simple strategy that goes long when HMM4_CumWeight2 > 0.5 (bull market) and short when HMM4_CumWeight2 < 0.5 (bear market).
Calculation Process
For each bar in the calculation range:
- The indicator determines the training window based on the UseFixedStartPoint parameter
- It creates a temporary array for the training window and fills it with close prices
- The HMM training is run on this window to determine the mixture weights
- The weights are sorted based on the product of means and variances
- The indicator buffers are updated with the cumulative weights for the stacked line plot
Comparison with VIX
While the original research for this model was applied to the VIX (CBOE Volatility Index), the HMM4 indicator can be applied to any financial instrument. The advantage of this approach is that it doesn’t require a specific volatility index like the VIX to identify market regimes.
The indicator directly analyzes price data to identify different market states, making it applicable to any market including forex, commodities, stocks, and indices. This versatility makes it a valuable tool for traders across different markets.
Conclusion
The HMM4 indicator provides a sophisticated statistical approach to market analysis. By modeling price data as a mixture of Gaussian distributions, it can identify different market regimes and provide valuable insights for trading decisions.
The key advantage of this indicator is its ability to quantify the probability of the market being in different states, with a simple rule for identifying bull and bear markets based on the cumulative weights. This makes it a powerful tool for both discretionary and systematic traders.
By adjusting the input parameters and combining the indicator with other technical analysis tools, traders can develop robust trading strategies that adapt to changing market conditions.
Download the Indicator
The HMM4 indicator is available for purchase on the MQL5 Market. Click the button below to visit the product page and download the indicator.
Note: The HMM4 indicator requires MetaTrader 5 platform. After purchase, the indicator will be available in your MQL5 account and can be installed directly through the MetaTrader 5 platform.

www.mql5.com (Article Sourced Website)
#Exposing #Hidden #Market #Regimes #HMM4
