Welcome to the Artificial Intelligence Outlook for Forex trading.
VIDEO TRANSCRIPT
Hello, everyone and welcome back. My name is Greg Firman and this is the VantagePoint AI Market Outlook for the week of March the 13th, 2023.
SPDR SPY ETF $SPY
Now, to get started this week, we’ll begin with we’re going to start with the SPYs this week. Again, we’ll use that as an alternate to the S&P 500. I think what we deem to do here, is clear up a little bit of confusion here. When we look at the actual performance of the SPYs, which is very, very important if we’re creating heat maps and percentages, and the drawbacks of some of this type of technology.
When we look at it, you can see here that we’ve got our six-month performance, -5%. I’ll discuss that in a minute. Three month at 1.87, one month at 5.42, and five day at 4.52. The theory is that this creates a bare scenario. However, the SPYs are not down 7.9% on the year, as you can see as calculated by Barchart, which is the same way I would calculate it. What’s missing here is the year to date or the yearly opening price and how it’s measured from that.
The S&P 500 up 7.89%, and I believe the SPYs were up about the same, 7.8. But on the year, as you can see, they are still positive on the year. They are not negative. When we look closer at this, the advantage with the software with VantagePoint, is that you can see we put a bottom in on the SPYs. On October the 14th, we’ve hit a low. That low is consistent with the number that comes up here, which is 3.48. That is well within the two-year range or the two-year low that came in October of this past year.
But when we look closer at the VP charts, the SPYs have been moving basically only up ever since with very minor pullbacks, but the key point is we have not made a new low in six months. When we look at this right now, you can see, if we take a 52-week period and look at this going back, which is how some people do the rolling calculations or whatever. But the rolling performance, when we look at this, you can see going back into March of 2022, this is an unprecedented calendar year.
This is why I don’t usually encourage mixing up months because we’ve got earnings in the first quarter in January, we’ve got it in calendar years. But if you look at it from this perspective, when the Fed really started aggressively hiking, we moved down in 149 days, 17.42%. But as you can see, in just 76 days, we’ve moved up 20%. Again, this type of data can be extremely misleading, so we have to make sure that we’re looking at that. During this period of using the VantagePoint software, we’re buying based around these crossover points.
You can see as we’ve crossed up and we’ve moved higher far longer than we’ve moved down. When we’ve moved down, it’s usually been, you can see from December the 12th or the 14th, and then we’re back up again in January. But again, it’s very important to make sure we’re not calculating things wrong, as it can be very misleading. Because again, on an annual basis, the SPYs and the S&P 500 are still slightly positive on the year, but they’ve never been down 7.9%. That’s simply not factual so we have to make sure that we’re checking our numbers.
But again, you can see that essentially the other thing that this type of system does tell us, that 3.48 is the low. If we don’t make a new low, it’s very difficult or harder to make that bearish argument. Now, there’s more than enough things going on in the markets that could easily send it below 3.48. But just be careful of a potential bear trap down here. With this most recent bank failure, in my respectful opinion only, that’s probably not going to be the first. The Fed is the one that is causing this.
Why would anybody put money in banks when they can throw it into a two-year treasury? This tells me that the Fed may have to change course and the media now is putting a lot of pressure on them. But if we look at this, we can definitely create our own type of heat map or analyze price like this, as long as we make sure we’re combining it with the VantagePoint software, and we’re actually using factual numbers, not made up numbers.
We can’t take the high from the year and then say, “Well, we’re down 7.9%,” because again, and that’s not just me saying that. You can see this is a free tool that’s on Barchart. You can use this for any ticker symbol you want to do this analysis. Yes, on a five day it’s bearish, for sure. But the other thing that I might point out here is that off of that, in a six-month period, we’ve moved up 10.86% off that 3.48 level, and we’ve only moved down from the high 7.75.
Again, you could count that on a six-month basis, but on a year-to-date basis, that’s simply not factual. From here, the main indicators, again, when we break this down and we look at this on a closer perspective. This is why it’s so important to use the yearly opening price. Because when we use that yearly opening price, we’re able to basically see where we are in the new calendar year without getting it confused with something else.
A lot of times, this is what you will see happening, is that people will try and create a situation that supports their narrative by somewhat fudging the numbers maybe, or getting confused as to how to calculate actual performance. Again, when we look at this on the year on the SPYs, we’ve started off the year, this blue line represents the yearly opening price. This is what happens is people get confused and say, “Well, since we’re moving lower, that all of a sudden it’s no longer bullish.”
Well, that’s partly true, but my argument would be here that first of all, we are not negative on the year, nor have we ever really been negative on the year on the SPYs or the S&P other than for a few hours. Now we’ve stalled the week right on the yearly opening price, 3.84 is the yearly opening price. You can see we’re closing just a hair above that at 3.8591. The indicators are absolutely bearish, but again, is it possible that the inflation is going to?
U.S. Dollar Index
We’ve got a very heavy docket next week. The one you want to focus on is retail sales. We want leading indicators, not economic indicators, not lagging indicators. Very, very important that I point that out. The CPI data, again, the dollar strengthened last month initially when it came out, and then the dollar is tanked ever since. For the most part, we are still unable to make any significant new highs on the dollar.
When we look at the dollar index in reference, you can see when they’re saying, “Well, it’s dollar, dollar, dollar,” well, I would respectfully disagree with that. Because as you can see, the dollar has not made a new high in a very, very long time. Now, it is positive on the year, but the question is now can it remain that? As we discussed in last week’s weekly outlook, significant, verified resistance at 1.0580. We need a clean break of 1.06 and break away out of this for the dollar to actually remain positive.
But even on the year, the dollar index, when we look closer at this, it’s very easy to get mixed up with some of these tools. I believe the dollar was moving lower anyway on Friday, regardless of that payroll number because of the Silicon Valley Bank. The market’s now questioning, “Okay. Can the Fed really afford to keep hiking here?” A lot of media, very, very strong, are making a very strong argument that he’s gone way overboard here. This may not be the first bank that goes down because of it.
Again, I believe that the market will be rethinking and it may take some of the heat off that inflation data, but right now, we are above the yearly opening price. The S&P 500 and the SPYs are holding right on there. We’re really at a make or break point here, but in a very, very busy economic week. Make no mistake, guys, the next moves in the market will be fundamental-based. They will not be technical indicators. That’s just not the case in this coming week.
But the main thing is, is to know and understand your level. Again, using some of the tools like this, you can also do this with the dollar index. You can bring this up and say, “Okay. If I want to do this, I’m going to put in the DXY, right?” I could say, “Okay, I’m going to look at the dollar index.” The only thing is you’re going to have to put up with a bunch of these crazy advertisements, but you can bring this up and run the same scenario here. Then we look at the year to date, the dollar’s just recently made gains.
It’s been down the entire year, it’s been down since the beginning of October. Just looking at a basic chart of the dollar over a nine-month period tells us that. As you can see, there are no new highs here. I’m still shocked that it got up that high, but remember, the Fed is unlikely to carry on aggressive hikes. I don’t believe the hikes coming will be any more than 25 basis points, if anything. The Bank of Canada has already stopped.
The Bank of Canada further took a shot at the Fed this past week and said, “We don’t care what the US Fed is doing. We’re not hiking.” I believe that the other central banks are going to be looking at the Bank of Canada and saying, “They might be right here.” If there’s any more banks that there’s a red flag on, I’d love to see the books on this one to see how much is mortgage-backed securities that they’re in trouble with too, right?
But again, we got to make sure that we’re looking at these things. We’ve got some pretty strong levels that I’ve talked about for the last two months saying, “Look, we need to clear through this 1.0591, 0582 area, break free and clear of it.” But even if we do, we still have additional verified zones up here that will provide potentially additional resistance. But again, it’s going to be fundamental data-driven. My advice is be very cautious next week because as you can see, things are not always how they appear.
When we look at the dollar over the six-month period, you can see here that it’s a very mixed bag. We’re negative on the three-month, negative on the six month. The year to date is barely positive. Again, we’ve got to make sure that if we’re using heat maps, I don’t call it necessarily a heat map. What I’ll call it is simply doing price analysis. As you can see, it’s nowhere near as strong as what it appears.
But for now, when we look at it in next week’s trading, the key level, which we came down to actually on, we came down I believe on my platform. I came down lower than that, lower than 1.04. I think I hit 1.0350 on mine, saw a significant failure at that 1.0580 level again. As you can see, we hit a high of 1.0588, and the dollar bulls are caught in a bull trap. We still have our T-cross long down here, but I believe that the yearly opening price is the one we need to watch.
The same as what I would argue with the SPYs, I would say, or the S&P 500. Doesn’t matter to me if I’m a buyer or a seller, the only thing that matters is that I know the proper levels. I know the proper percentages of whether something is bullish or something is positive. Something as simple as whether something is positive or negative on an annualized basis, on a yearly basis, year to date. Again, with any type of system you’re using, this was one of your most important right here, year to date, because it tells us what the primary trend is.
The primary trend on the dollar in 2023, has largely been down. If you look at the basic chart, you can see it clear as day. We have not been able to hold above the yearly opening price until recently. This is fact not fiction, you can see it all along here. This blue line, we only recently went above in about less than a month ago. We’re almost two months in, and the dollar can’t turn positive on the year. Again, when you’re looking at the proper numbers, you can see that.
We’re positive on the five day, we’re positive one month, but on a three-month basis, we’re negative. On a six-month basis, the dollar looks terrible, but then year to date, it’s positive again. These are the things we want to make sure we know in our trading and understand. But this is again, this is a free tool with Barchart, which will give you a vast amount of data. Just be careful how you use it, because even the best tool is dangerous in the wrong person’s hand.
Again, always make sure that you’re calculating the yearly performance properly, because that’s very, very important in our trading. When we look at the broader market, all eyes will be on the dollar next week indisputably.
Gold
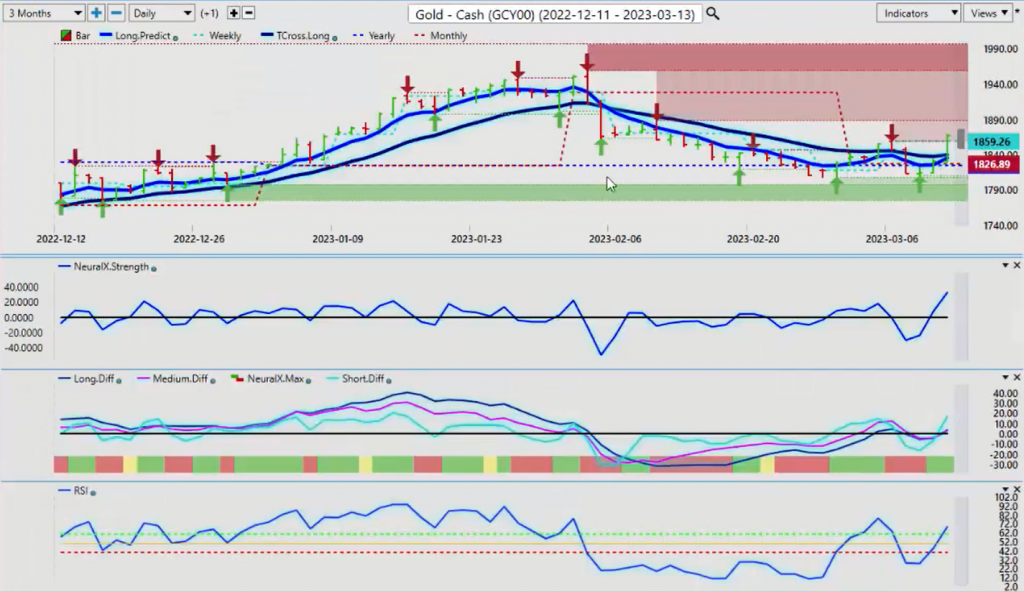
But as you can see, gold is making its move. It’s starting to turn higher. Again, this screams of recession here. It also is telling me that a number of market participants are very concerned about that, Silicon Valley Bank, very concerned.
The media, a number of economists, Jeremy Siegel, Muhammad El-Erian, there’s just a long list of them that are saying the Fed has completely lost his mind here. He should not be hiking like this. There could be catastrophic events that are caused by it. Well, they weren’t wrong, were they? The first one has already happened, and I have trouble believing there’s only going to be one or two, or three or four because just think of it as simple as that.
Why would we park our money in a bank when we can park it in a two-year treasury? That’s the easiest way for me to say it, right? If the banks aren’t getting those deposits, then the banks can’t meet their obligations, right? Right now, gold has made a significant push. I would argue that this was already in motion. You can see the predicted RSI starting to turn higher. The predicted differences here moving up, we cleared the first, VantagePoint predicted moving average.
But as you can see, once again, using that yearly opening price as a focal point, the market, soon as we closed above that, and I will point this out clearly. This move was already in progress on Thursday. Soon as we closed above the yearly opening price, gold turned positive. Then on Friday, I believe that they already knew that number. I believe that some market participants knew a whole bunch of things that were going on, because they were already moving into gold before any of this happened.
Again, watch for continued rally potentially in gold. Again, use the yearly and the monthly opening prices to gauge where you are right now. Because something shows bearish for a one month, a five month, or a six month, or three month, five day, whatever, that’s a very, very small picture to be betting on. Again, we’ve got to utilize those VantagePoint indicators. Because again, even if we look and we look at the SPYs over that period of time in the last six months.
I would argue it was some of the best longs I’ve had all year, has been in the last six months. Again, there’s a number of analysts that were saying how bearish it was during that period. They seem to have forgot that again, that there was actually a very significant rally during that particular period. We don’t want to ignore these things. Again, if we’re looking at the actual performance over a six-month period, then I would look for something similar and say, “Okay. I have a failure point. I’m not making any new lows.”
A new verified zone formed off that particular bar on October the 13th. Then we look at that going into the first part of the year, or even if we go to where we are closing right on the yearly opening price this year. Then we can look at that and say, “Okay. Well, on that same 250 shares, we’ve gone up 11.46% in the last six months with very, very minor pullbacks.” The beauty of the VantagePoint software is that not only does it tell us when it’s good to go long, but it also points out the short.
But as you can see, that these moves lower were very short-lived. They were about 10 days, and then we start to turn back up again. These are the things we’ve got to keep an eye on. Gold, gold may be getting ready to turn around. When we look at the S&P 500, we see that it’s identical to the SPYs. If we go back six months on the S&P 500, and we look at this on the same date, October the 13th. Once again, we’ve got to make sure we’re looking at not getting confused by some of these percentage numbers.
Again, if I just look at it from that perspective, from the last six months after we’ve had a confirmed bottom, same thing, we’re up 11%. On the SPYs, the 3.48, one of the ways you could play this to avoid the volatility is put a straddle, the 3.48 price level on the S&P 500. You could do the same thing. The low point there is 3.491, you can straddle that point, buy down close to that. Have a sell order, a sell stop, get out of the long go short, just below the low point 3.941, so say 3.475, 3.480. We break down through that.
You dump the long and you go short. Easy-peasy, guys. If we keep things simple and make sure we’re using the correct numbers, and we bring in some strong tools, additional tools. Because don’t get me wrong, these percentages can be very helpful, but none of them are of any use, unless you have the year to date in there, particularly in the first quarter and the fourth quarter. This is a critical period for that. When we look at some of the other markets, obviously Bitcoin is being affected.
Bitcoin
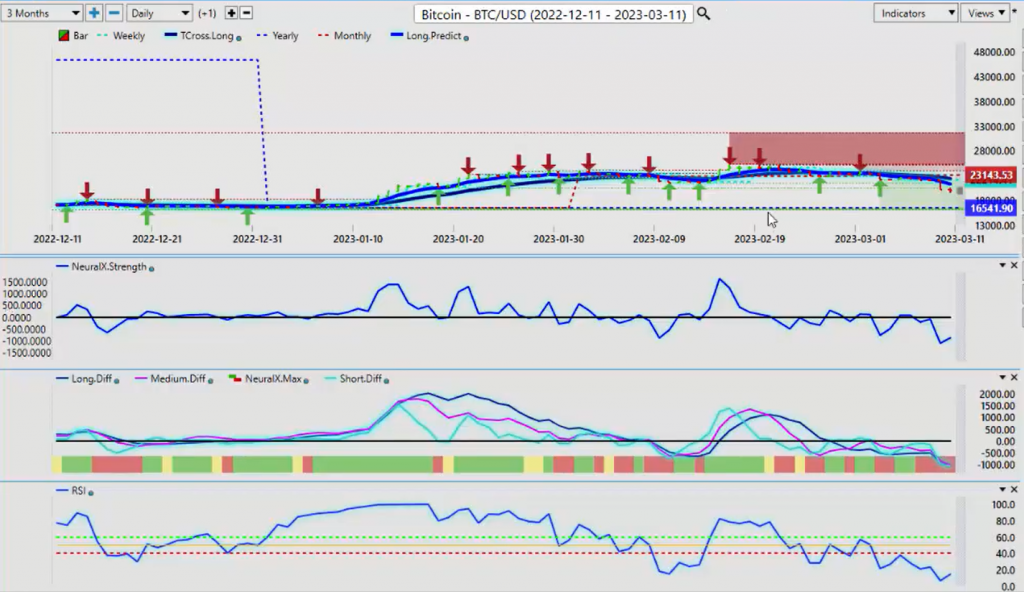
Bitcoin is a 95% correlation to the S&P 500. It has room to extend lower. The SPYs, the S&P 500, they’re at their yearly opening prices. We still have a gap on Bitcoin, but if the SPYs, the S&P 500 continue to move lower, then Bitcoin will follow here, guys. That would be something we would look for, but that reverse check mark that I often see in the neural index strength and on the predicted RSI, is a bit of a warning sign that maybe it’s not as quite as ugly as what we think it is.
If the Fed even hints that he’s backing off these rate hikes, then that’s going to fuel money back into risk assets, which I think right now I’m not sure he has another choice. But if he stays the line and keeps hiking and saying, “More and more hikes, yes, the dollar can go higher. Yes, stocks can go much lower.” It’s not about being right or wrong in trading, or your indicator’s better than mine or this analysis is better than that. What it’s about, guys, is understanding the levels, the proper percentages, where we’re actually at in the new calendar year.
Do I want to bring the mess of 2022 into 2023? No, actually I don’t. I think the bulk of the hikes are staying in 2022. There are still going to be hikes in 2023, but there’s not going to be as many and they’re certainly not going to be as big. I don’t see anything that could justify a 75 basis point hike or even a 50 at this point. After the bank failure, no, I think the Fed would just make things way worse for everyone and everything, including himself.
Again, we’ve got more downside on Bitcoin. Be careful with that one on longs until we get near that yearly opening price, and we see what the main inner market correlation is going to do here.
Crude Oil
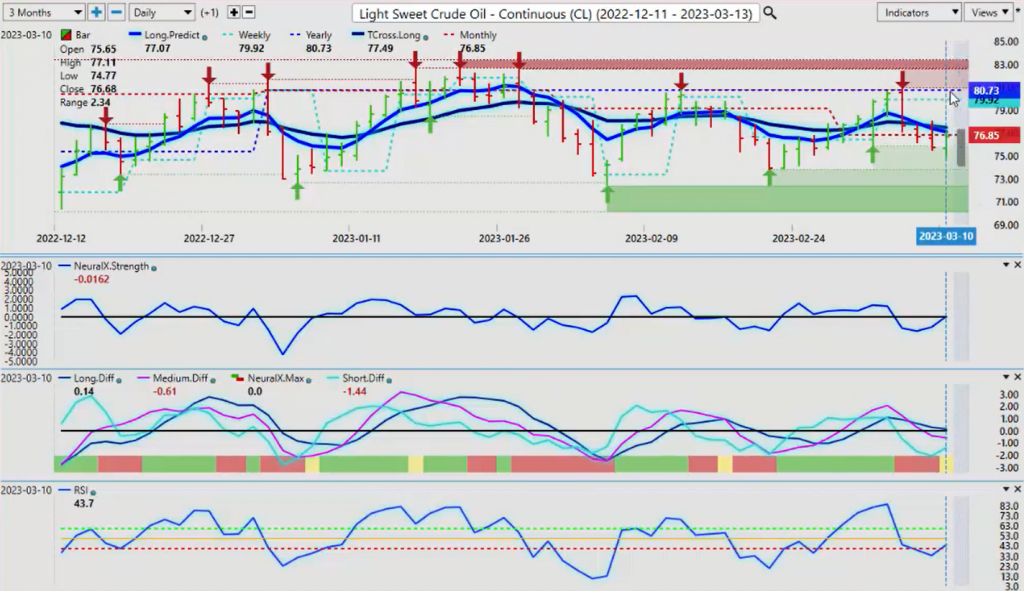
Light sweet crude oil is rebounded a bit, but if we’re moving into the potential for a recession, then that usually does not do well for oil. Oil firmly below its yearly opening price. There’s another example of using the current, accurate annualized numbers where you can see.
Do we really think that this is a coincidence that it hit this level 1, 2, 3, 4 times over the last two and a half months? That’s not a coincidence, guys. That’s a trading opportunity. The same thing you may have on the SPYs, on the S&P 500, on gold, on the dollar index. Very, very important and again, we don’t want to keep dragging things from the past forward. A lot of those things are better off left in the past. For oil right now, if we can get above the monthly opening price at 76.85, we have a chance of extending back to 80.73.
But my optimism on that right now remains heavily guarded, unless the other risk assets come around and unless the Fed backs off these rate hikes a bit.
Euro versus U.S. Dollar
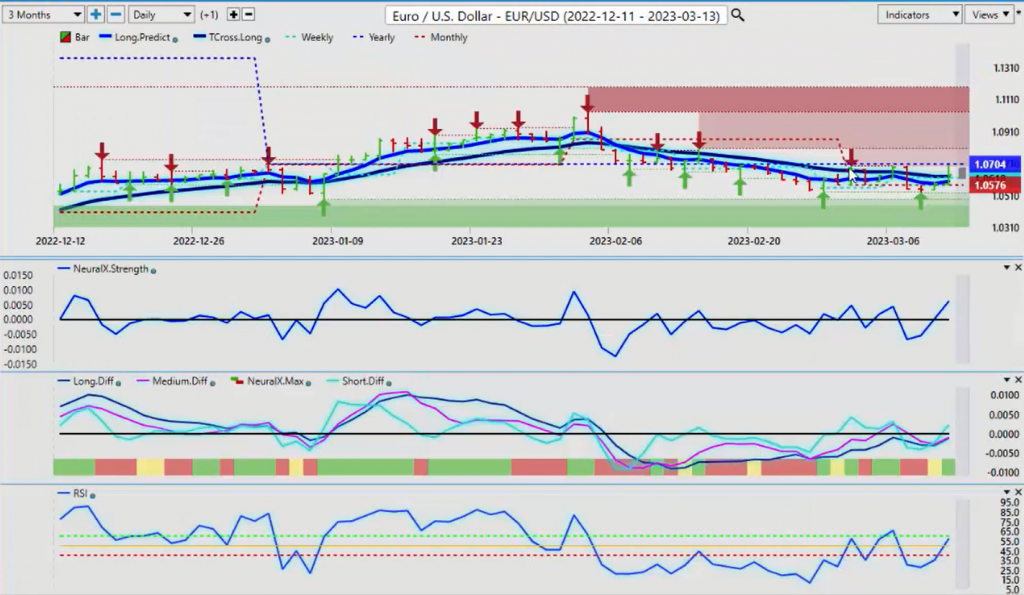
Now the Euro/US this past week, once again, we were doing this one in the VantagePoint live training room, very difficult to script this type of stuff here, guys. The Euro originally held the yearly opening price back here. We broke down back in and around the early part of February.
But remember, February is a known period of dollar strength and part of March. Then in April, that’s when your gold traders come in. Gold is usually stronger in the months of April and May. That’s when the dollar buying usually drives up, but again, fundamentals are going to drive the dollar, not technicals here. When we look at the Euro, we’ve had a absolutely gift coming right back up to that yearly opening price touching 1.0704. On Monday afternoon, we were doing this in the VantagePoint live training room.
Then this thing just went down like a wet bag of cement, a fantastic trade. Again, we’re sticking with that primary theme that if it’s below the yearly opening price, it’s bearish. If it’s above it, it’s technically bullish on the calendar year. Very important, powerful indicator to be using at this time of the year. Now, the Euro has had a dramatic rebound because I think the sharks smell blood in the water with the Fed.
That’s my view, anyway. I think they’re saying now the Fed is not going to be able to keep, he’s not going to be able to go 50 basis points. He probably is going to start changing his rhetoric within the next few months. Again, if the Euro can clear, if we can clear that, but the one thing you want to understand with the Euro, guys, is not get all caught up in accumulation this and distribution that, and PSIs, MACDs. We can throw 50 different indicators at this, but gold and the Euro are very much one and the same trade.
That pushup in gold, in my respectful opinion, is what is pushed the Euro back up. The Euro will often follow gold like this. Once again, if gold continue to advance, then you are potentially looking at further Euro strength. I don’t think you’re going to have you may not have a lot of Euro strength, but again, this is all going to depend on what the Fed does here, right? Currencies go in very, very long trends. What they do is it takes years to go in one direction.
The Euro back in 2002 went from basically the parody level all the way up to the 160 level, right? Now it’s come all the way back down to the same level, and now it’s moving back up again above parody. Is this a long, slow grind back up? Yeah, it’s possible. These are things we look at, but first of all, we need to get positive again on the year. The Euro did spend the month of January, you can see that we didn’t have confirmation of it actually confirming we’re turning bearish until about the 16th of February, right?
This is a known seasonal pattern. If you look at things over the last 200 years, multi-asset portfolio, seasonals remain one of the top tools to use. Artificial intelligence is now on the scene so if we’re combining these two things, that is a winning combination. Then basic price structure. Where are we in the month versus the open? Where are we in the year versus the open? What does it look like the previous year? But again, we want to stay current with our pricing because things are changing very quickly.
U.S. Dollar versus Swiss Franc

The US-Swiss Franc took a big hit on Friday on that dollar collapse, and that was inevitable, because it’s most of your junior, less experienced traders that are pouring into dollar longs and saying dollar longs only. Well, as you can see, that didn’t work out quite so well. Again, the dollar really taking a hit. My bigger concern that I’m watching for here now is 9251, the yearly opening price has been breached. The question is, do we stay below this level?
Again, this pair right now as of Friday, it’s turned bearish on the year. This is fact not fiction, okay? The question is, can we hold below that? For next week, 9251 is the level to keep your eye on. If we can’t get over this thing and close above this thing on Monday and Tuesday, then it’s probably got a top in here. The other thing that I’ve been monitoring in the month of March is this red line, the monthly opening price. We are unable to clear this.
You can see, we have failed exactly on the monthly opening price multiple times. Even this silly Fed testimony on Tuesday, even that couldn’t push us positive on the month. Again, facts matter, guys. Price action, the yearly opening, the monthly opening, so we can’t breach the monthly opening price to the upside. Now we’ve breached the yearly opening price, excuse me, to the downside. That’s a big problem for the dollar here, guys.
Okay. A risk-off scenario, in a risk off, money flight to safety doesn’t always go to the dollar, it goes to the yen and it can go to the Swiss Franc even more. Clearly, they’re getting out of dodge here is what they’re doing. The indicators are still pointing down, watch for a potential move. But let’s see what happens at 9251.
British Pound versus U.S. Dollar
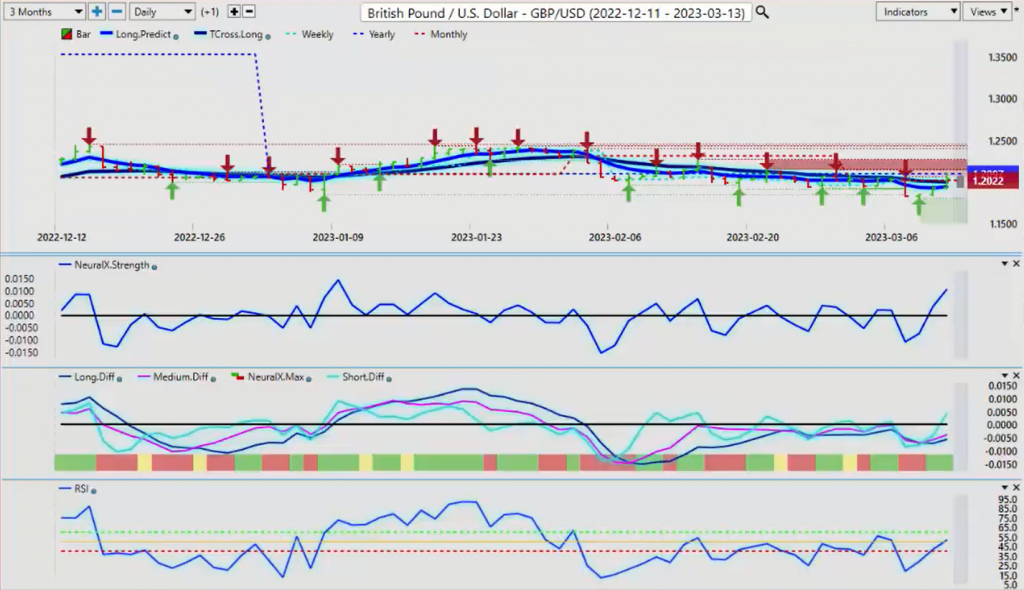
Pound/dollar, again, another place of value to sell dollars. The signal is starting to move to the upside.
Now, this started even after that, again, that Fed testimony on Tuesday. You can see that it’s just noise. Turns around and they immediately started dumping dollars long before any of the data even came out. The yearly opening price here, we’re going to be coming in about 1.2097. Our VantagePoint T-cross long, 1.1995. If we can clear both of those two levels, then we can look for a potential move out of this particular area. But in most cases, the dollar seasonal pattern doesn’t end until early April.
I’m still anticipating more dollar strength. The question is, can we finally break through that key level that I’ve talked about? Since January, basically January 1st at 1.0588, which we’ve still been unable to do, but we’ll keep a very, very close eye on that particular pair.
U.S. Dollar versus Japanese Yen
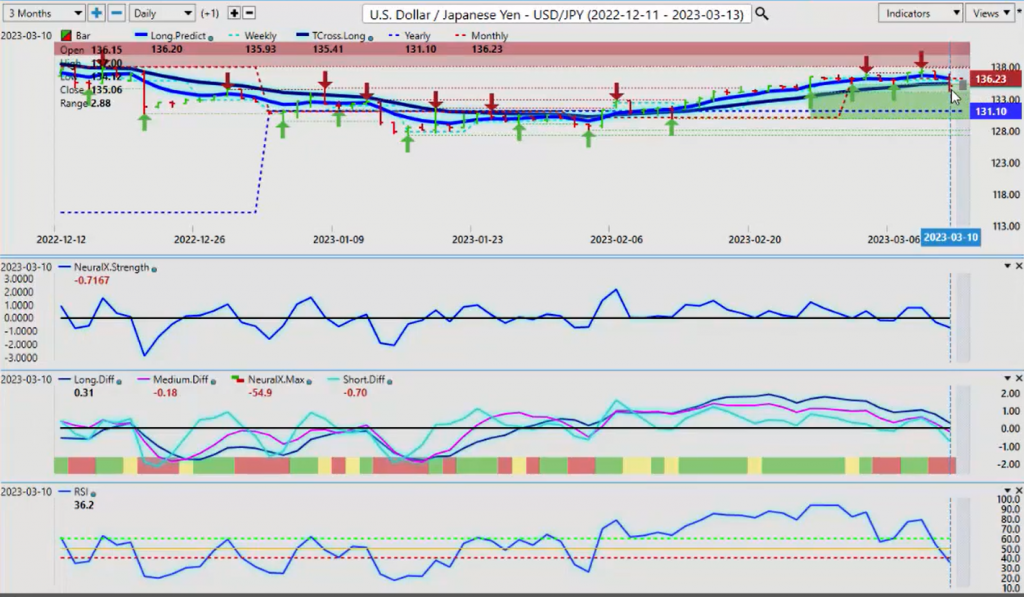
Now, with the dollar/yen, once again, when we talk about a true flight to safety, that doesn’t always involve the US dollar. It does against certain pairs like the AUSI, the New Zealand, the CAD, but the other currencies are not responding the same way.
The dollar’s taken a big hit on Friday, but I would argue that that was already in progress when we closed below the VantagePoint long predicted at 1.3661. Now we’re closing under the T-cross long, that level 1.3541, that’s the area we want to keep our eye on to start the week. The indicators are turning negative, the pink line is crossed, so we’ve got a medium term crossover to the downside. The short-term crossover to the downside. The predicted RSI is pointing towards dollar losses.
The breakdown of this, but again, don’t trust this payer. The interest rate differential between the US and Japan, is huge and it’s only going to get bigger. But that isn’t necessarily going to save the dollar against the yen on a flight to safety concern. Right now, be cautious. If you’re shorting this one, be cautious and make sure that the market is staying below 1.3541 next week. Because again, this is an outlook, not a recap of something that already happened. When we look at the main three equity base currencies, they’re all basically responding the same way.
U.S. Dollar versus Canadian Dollar
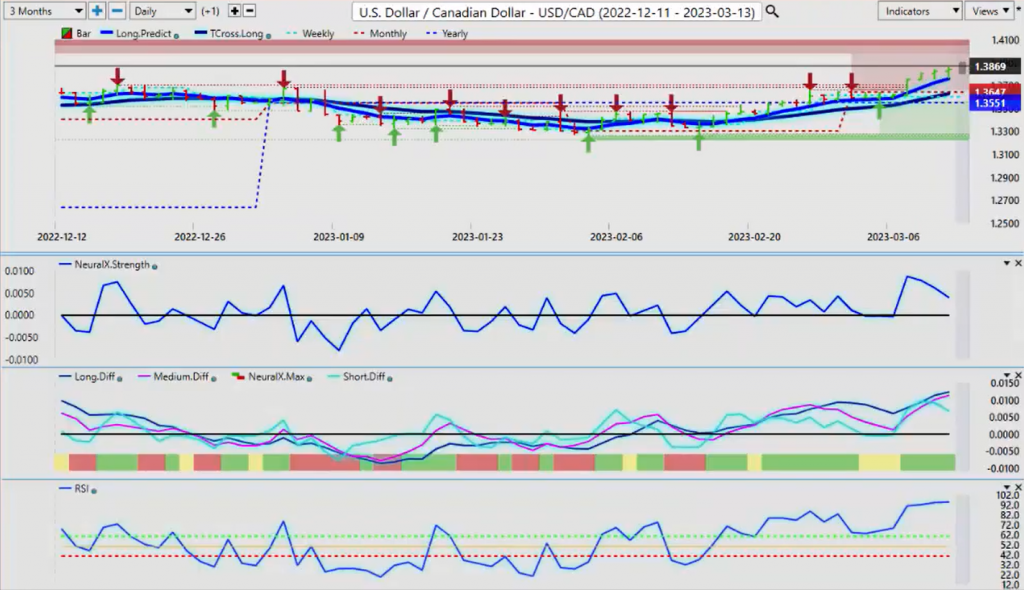
The US/CAD, AUSI/US, New Zealand/US, they respond to a strong or weak equity market, or if it’s a risk on environment, the CAD, the AUSI, New Zealand, they’re your best friend. Right now, as you can see, we’re not exactly in a risk on environment so the Canadian dollar’s really taking a hit. Of course, the Bank of Canada has said they’re not hiking this month and they’ve got it right. It’s the Fed that’s got it wrong. It’s going to be very interesting what he does next.
But I wouldn’t want to be him is what I’ll say. But for now, when we look at this, you can see we’re flattening out here on the predicted RSI. The predicted differences are overextended. We could see this turnaround, but let me be clear that a turnaround for this payer to turn around, we need the Fed to soften his position, and we need equity markets, including the SPYs, moving back up. That’s what we need, and Bitcoin moving up, high correlations.
Australian Dollar versus U.S. Dollar
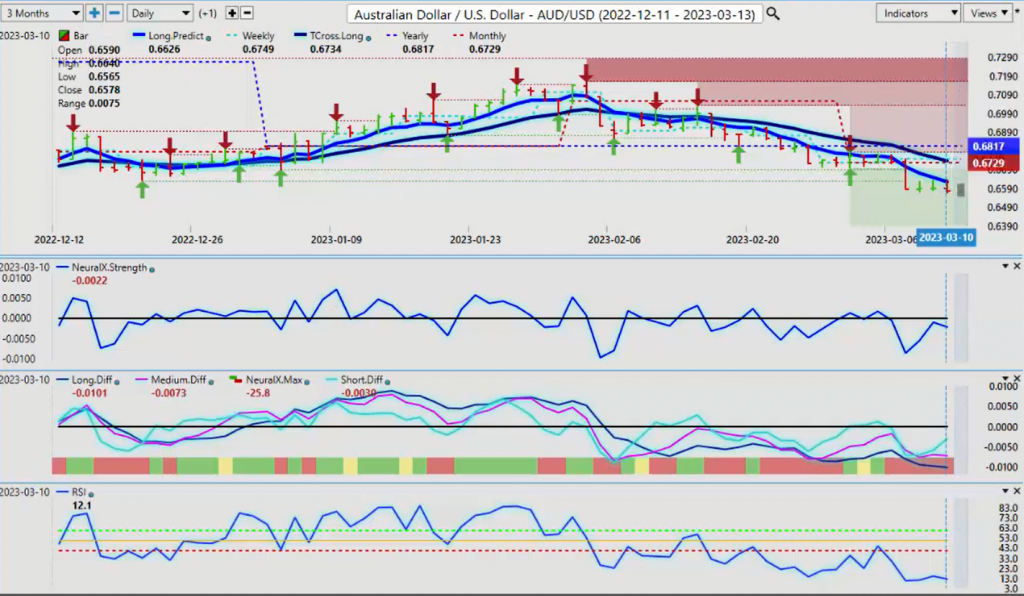
We’ll see the same thing with the AUSSIE. If we get any kind of turnaround, then we could have a very good buying opportunity. But again, as you can see from last week, when they’re saying how strong the dollar is, well, in actual fact, that’s not really true, is it? When you look at basic price structure, that there is simply no sellers down here. To start the week, this is a pretty easy one in my view. You’ve got all of your support here sitting around 6565.
My strong advice, which I would tell my own direct clients on a regular basis, is expect some Monday, Tuesday reversal. It occurs every week. If the dollar comes out of the gate super strong on Monday, chances are it’s going to tank on Tuesday, and in most cases it does anyway. After the non-farm payroll number, it retraces, if not tanks completely. At the very minimum, there’s some retracement, so we could see some buying opportunity here but we need stocks higher.
New Zealand Dollar versus U.S. Dollar

Same as New Zealand. If we can’t get those stocks higher, then this won’t move either. But the indicators are starting to roll over positive on New Zealand/US. You can see the cross, the neural indexes turned positive. I love the angle and position of the neural index strength. Again, it’s very, very important that we’re watching multiple indicators. Again, that we know where our levels are for New Zealand, the AUSI, the CAD.
First and foremost, we have to get positive on the month before we can even think about targeting the yearly opening price. You can see the three of them are exactly the same. Now the monthly is stacked just below the yearly on the AUSI, the US/CAD is the same thing. It’s basically telling us where our retracement points are, 1.3647, 1.3551. The VantagePoint T-cross long in this particular case, with US/Canada is right on the T-cross long 1.3628.
Either way, that’s our retracement point. With that said, this is the VantagePoint AI Market Outlook for the week of March the 13th, 2023.

https://www.vantagepointsoftware.com/blog/vantagepoint-ai-market-outlook-for-the-week-of-march-13-new-2023-26″>
#Vantagepoint #Market #Outlook #March